UMAP
seqlearner.MultiTaskLearner.visualize(method="UMAP", family=None, proportion=1.5)
Uniform Manifold Approximation and Projection (UMAP) is a dimension reduction technique that can be used for visualisation similarly to t-SNE, but also for general non-linear dimension reduction. The algorithm is founded on three assumptions about the data 1. The data is uniformly distributed on a Riemannian manifold; 2. The Riemannian metric is locally constant (or can be approximated as such); 3. The manifold is locally connected.
The details about the underlying mathematics of UMAP method can be found in the following paper:
- McInnes, L, Healy, J, UMAP: Uniform Manifold Approximation and Projection for Dimension Reduction, ArXiv e-prints 1802.03426, 2018
We have used the sklearn wrapper function which implements UMAP and applied it on the embedding results.
The visualize method has the following arguments:
Arguments
- method: String, Possible values are
TSNEandUMAP - family: String, Name of protein family to be visualized
- proportion: Positive float, population proportion of number of other classes by number of
Apply UMAP visualization on CRISP Protein family
from seqlearner import MultiTaskLearner as mtl
import pandas as pd
from seqlearner import Freq2Vec
sequences = pd.read_csv("./protein_sequences.csv", header=None)
freq2vec = Freq2Vec(sequences, word_length=3, window_size=5, emb_dim=25, loss="mean_squared_error", epochs=250)
freq2vec.freq2vec_maker()
freq2vec_embedding = mtl.embed(word_length=3, embedding="freq2vec", func="sum", emb_dim=25, gamma=0.1, epochs=100)
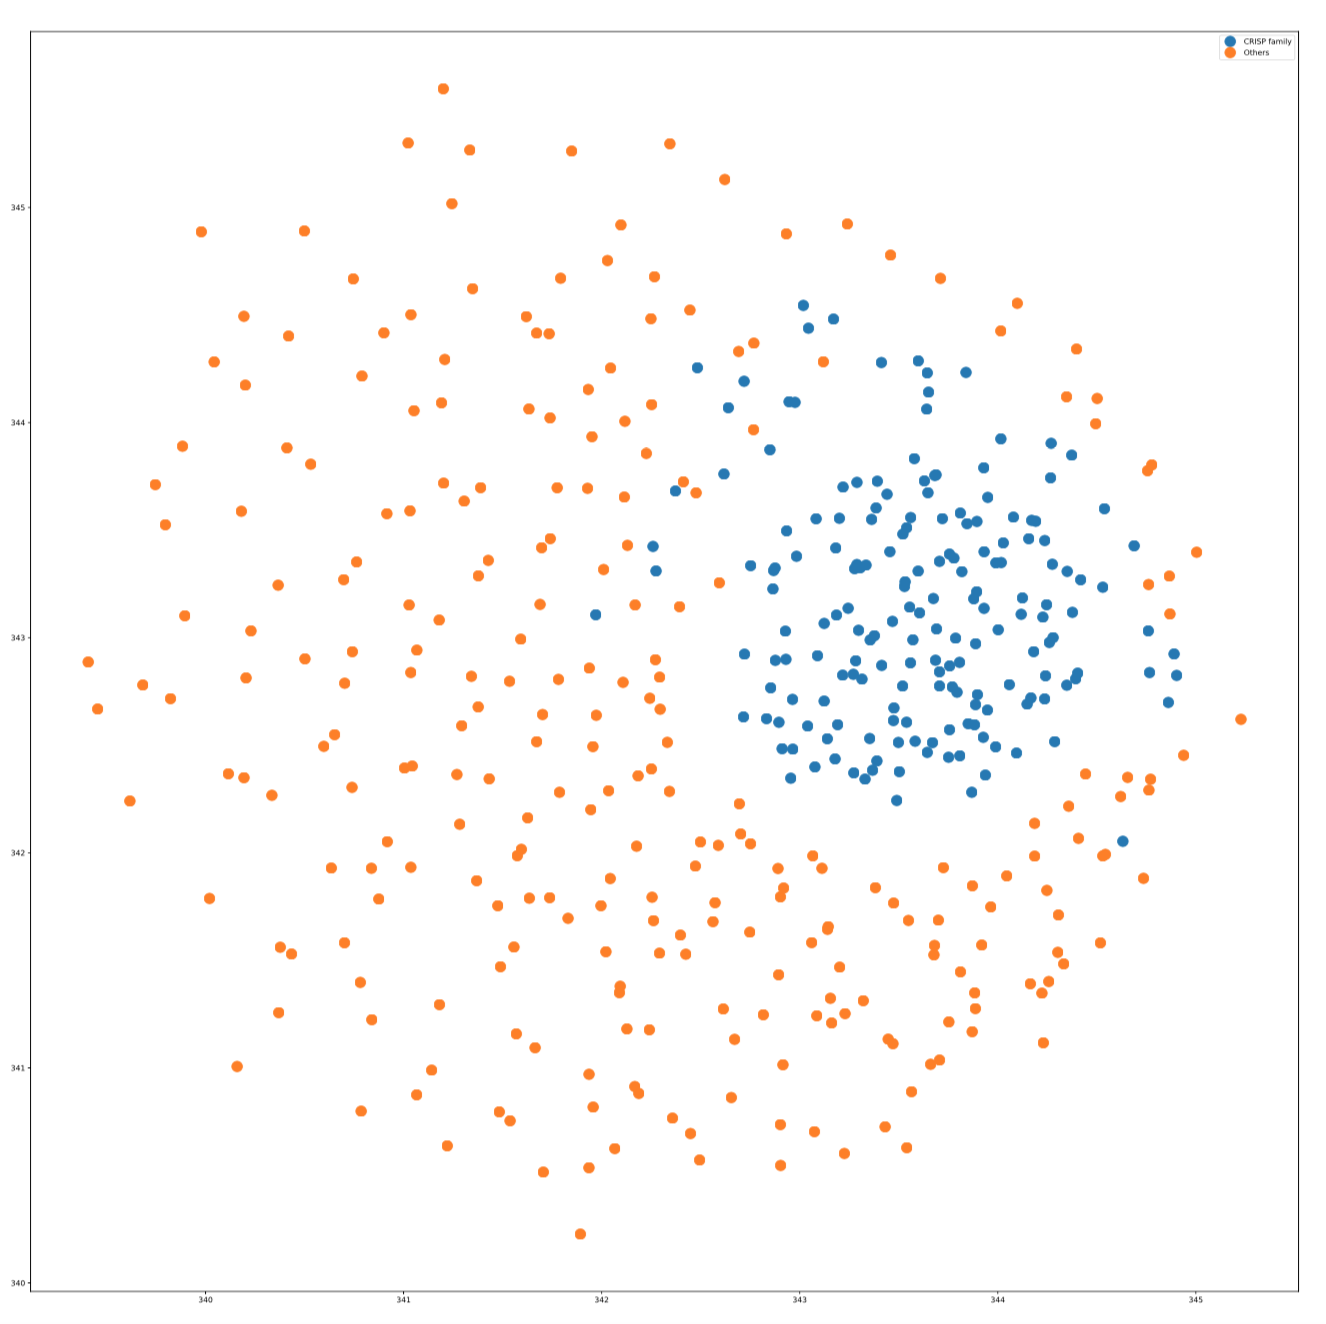
mtl.visualize(method="UMAP", family="CRISP_family", proportion=2.0)
The visualization plot is in the following: